Truth & Goodness
When Conversation Becomes a Way of Thinking Together
15 June 2026
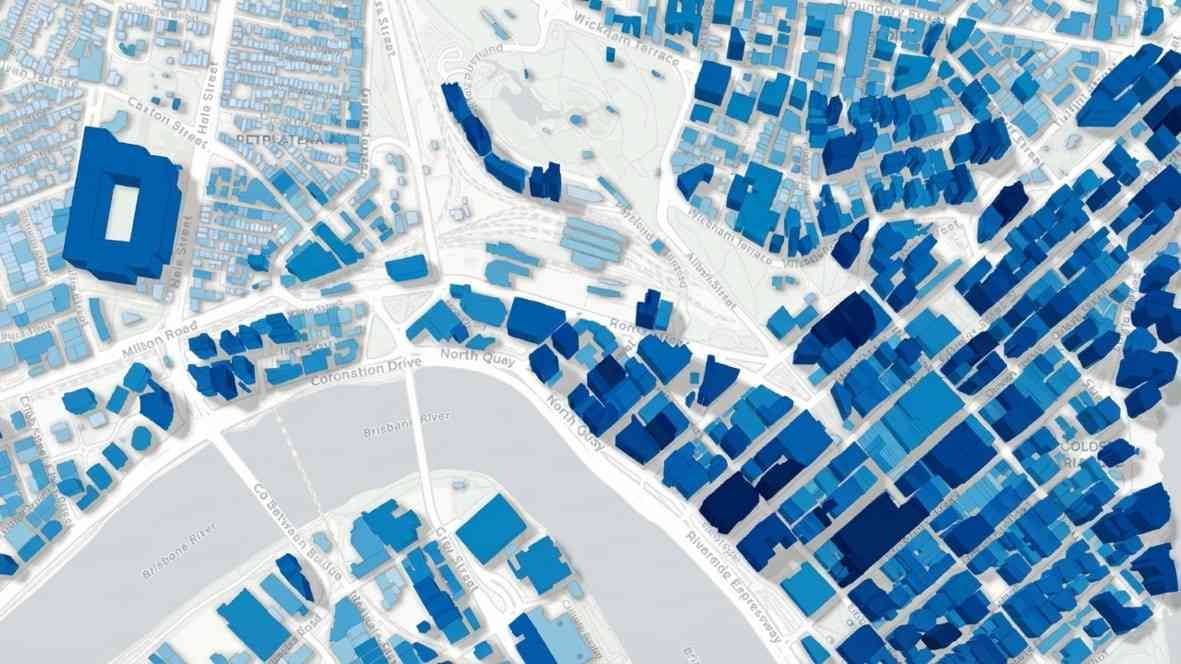
Scientists have created the most detailed 3D world map of global infrastructure in history. Covering an astonishing 97 percent of all buildings on Earth—from sprawling metropolises to tiny, remote villages—this project is more than just a visual curiosity. It is a powerful tool designed to predict disasters and revolutionize urban planning.
The architecture of nearly the entire planet has been captured on a single map. In one view, you can see dense metropolitan centers, sprawling suburbs, small towns, and villages scattered across the farthest corners of the globe. The creators of the project have managed to map approximately 97 percent of all buildings in existence today.
For the first time, this allows us to witness the immense and uneven changes occurring worldwide—and the vastly different ways people build and occupy space across different regions. Yet, this is only the beginning of what this map can offer.
It’s not just about the novelty of finding your own home in 3D, although that will certainly pique many people’s interest. This map provides real-world utility in planning urban development and new housing estates, as well as revealing irregularities that were previously difficult to detect.
It also holds significant environmental importance—allowing for better climate change analysis and risk assessment of various hazards. In practice, this could lead to faster reactions and decisions that will directly impact how we live in the future.
The project, named GlobalBuildingAtlas, encompasses a staggering 2.75 billion buildings. It was prepared with a precision of just a few meters, a level of detail previously out of reach for similar projects. This breakthrough was made possible by combining satellite imagery with Artificial Intelligence algorithms capable of “reading” structures from massive datasets.
No one had ever completed a task of this magnitude before. It was undertaken by researchers from Germany, led by Xiaoxiang Zhu. Instead of traditional methods, they turned to AI.
By combining machine learning algorithms with laser scanning technology, they were able to determine the height of buildings across the entire globe. The result is not only impressive but has yielded data that surprised even the project’s creators.
According to a study published in the scientific journal Earth System Science Data, Asia accounts for nearly half of all buildings included in this 3D world map. Furthermore, this continent not only has the highest number of buildings but also the tallest ones, with a total volume reaching 1.27 trillion cubic meters.
The data clearly illustrates the density of major metropolises and the rapid urbanization in India, China, and Southeast Asian countries. However, some of the most surprising data comes not from Asia, but from Africa.
Africa is the world’s second continent in terms of the number of buildings, totaling about 540 million. Despite this, their combined volume is relatively small, at 117 billion cubic meters. This clearly indicates that many regions are dominated by low-rise, small structures, often scattered over vast areas.
This 3D world map reveals not only the pace of global development but also persistent inequalities. It highlights places growing at lightning speed as well as neglected areas where development has clearly stalled—all of which have real consequences for people and the environment.
This tool isn’t just for viewing impressive visualizations; it’s for drawing critical conclusions. The real question is whether we can use this knowledge wisely.
Read this article in Polish: Powstała mapa 3D całego świata. Możesz zobaczyć swój dom


A graduate of journalism and social communication at the University of Rzeszów. She has been working in the media since 2019. She has collaborated with newsrooms and copywriting agencies. She has a strong background in psychology, especially cognitive psychology. She is also interested in social issues. She specializes in scientific discoveries and research that have a direct impact on human life.

Truth & Goodness
13 June 2026
Zmień tryb na ciemny